Problem 2.4
Canny Edge detection
Canny Edge detection is one of the most useful Edge detection algorithm, which uses linear combination of derivatives and consists of 3 steps.
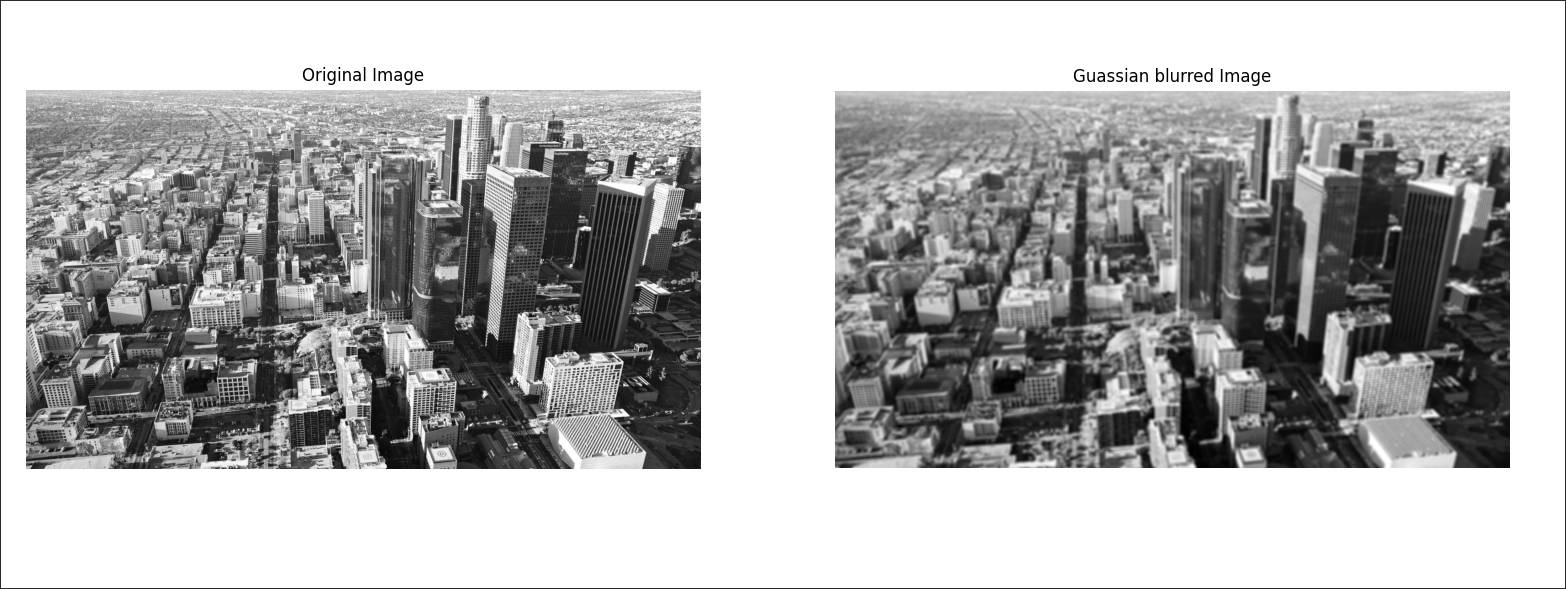
- Noise reduction with Gaussian blurring
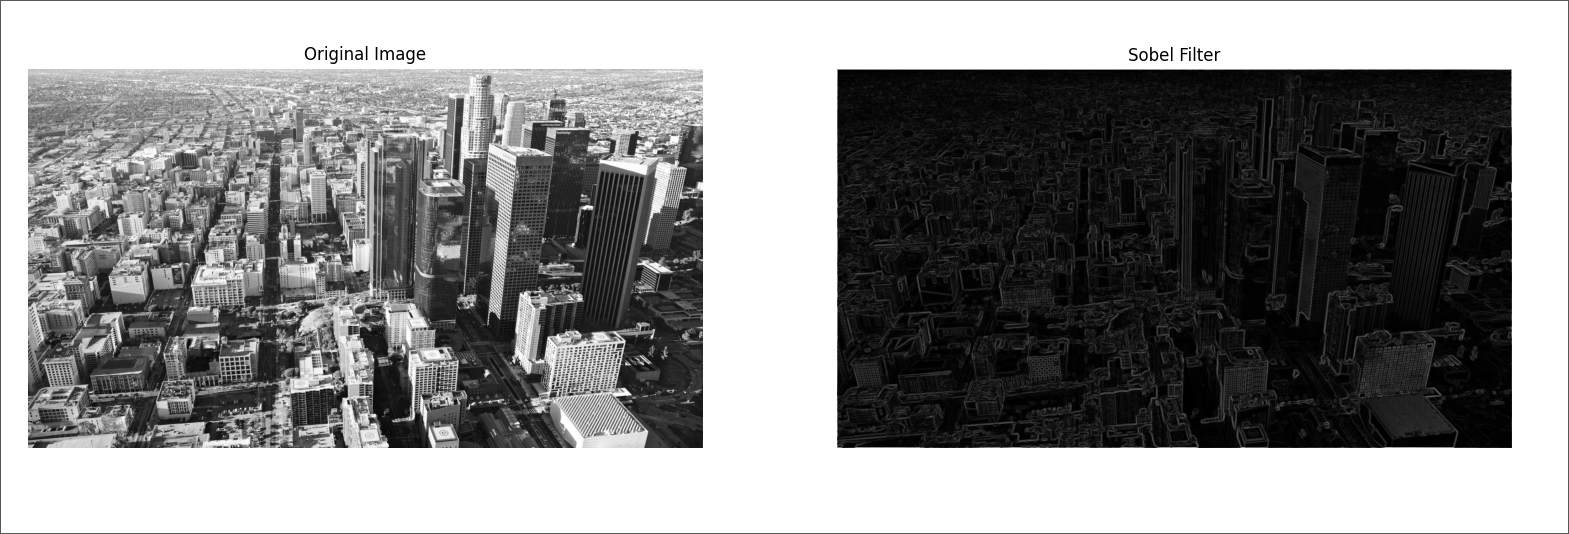
- Gradient Calculation with with Sobel operators
- Threshold
Noise reduction
to reduce noise on the image One can apply Gaussian blur to smooth it. To do so, image convolution technique is applied with Gaussian kernel
which is given by the following formula for
application of Gaussian blur
Gradient Calculation
after image is smoothed, the derivatives
then magnitude
application of Sobel filter
Thresholding
to make image more clear we will use thresholding with some threshold value of 30 pixels as default which can we adjusted based on the input image.
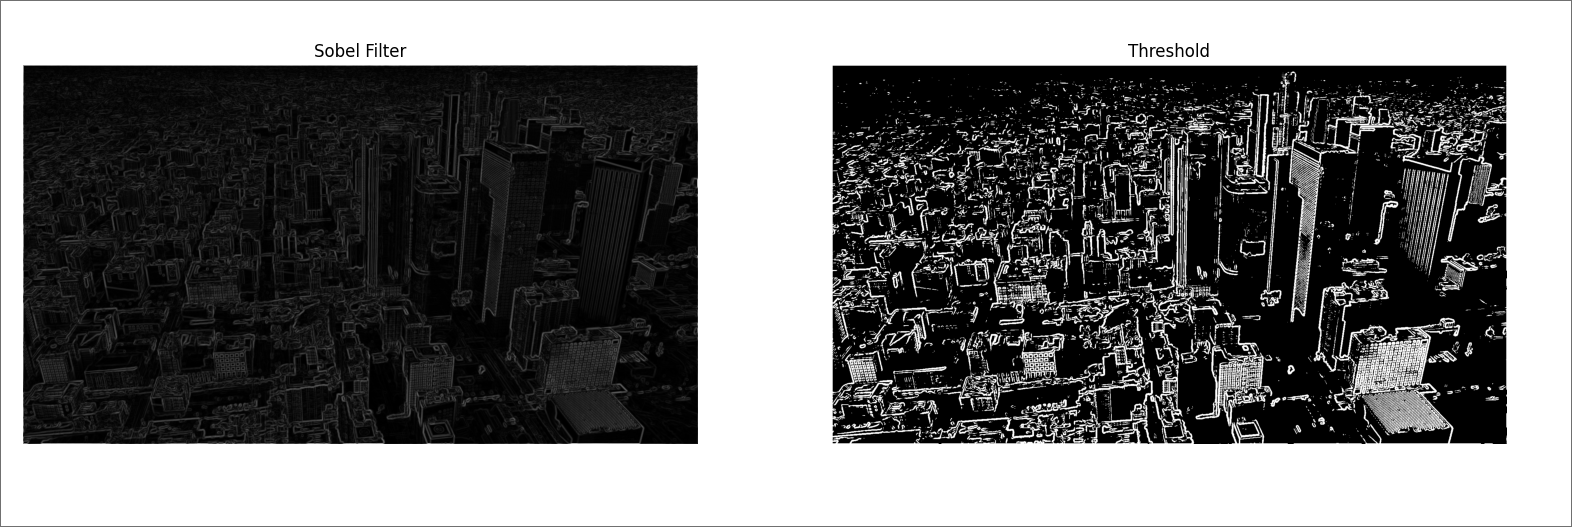
with this implementation
import numpy as np
import skimage.io as io
import skimage.color as color
import matplotlib.pyplot as plt
from scipy.signal import convolve
def convert_to_rgb_format(img):
if img.shape[2] == 4:
img = color.rgba2rgb(img)
return img
def convert_to_gray_scale(img):
return color.rgb2gray(img)
def gaussian_kernel(size, sigma=1):
size = int(size) // 2
x, y = np.mgrid[-size : size + 1, -size : size + 1]
normal = 1 / (2.0 * np.pi * sigma**2)
g = np.exp(-((x**2 + y**2) / (2.0 * sigma**2))) * normal
return g
def gaussian_blur(img):
ker = gaussian_kernel(5, sigma=10)
return convolve(img, ker, mode="valid")
def sobel_filters(img):
Kx = np.array([[-1, 0, 1], [-2, 0, 2], [-1, 0, 1]], np.float32)
Ky = np.array([[1, 2, 1], [0, 0, 0], [-1, -2, -1]], np.float32)
Ix = convolve(img, Kx)
Iy = convolve(img, Ky)
G = np.hypot(Ix, Iy)
G = G / G.max() * 255
theta = np.arctan2(Iy, Ix)
return G, theta
def threshold(img, T=30):
cp = np.zeros((img.shape))
N = img.shape[0]
M = img.shape[1]
for i in range(N):
for j in range(M):
if img[i, j] >= T:
cp[i, j] = 255
else:
cp[i, j] = 0
return cp
img = io.imread("./sky.png")
img = convert_to_rgb_format(img)
gray = convert_to_gray_scale(img)
g_blur = gaussian_blur(gray)
sobel, theta = sobel_filters(g_blur)
thres = threshold(sobel)
plt.figure(figsize=(10, 5))
plt.subplot(1, 2, 1)
plt.imshow(thres, cmap="gray")
plt.title("Pic 1")
plt.axis("off")
plt.subplot(1, 2, 2)
plt.imshow(sobel, cmap="gray")
plt.title("Pic 2")
plt.axis("off")
plt.show()
References and Helpful articles
Interactive Graph